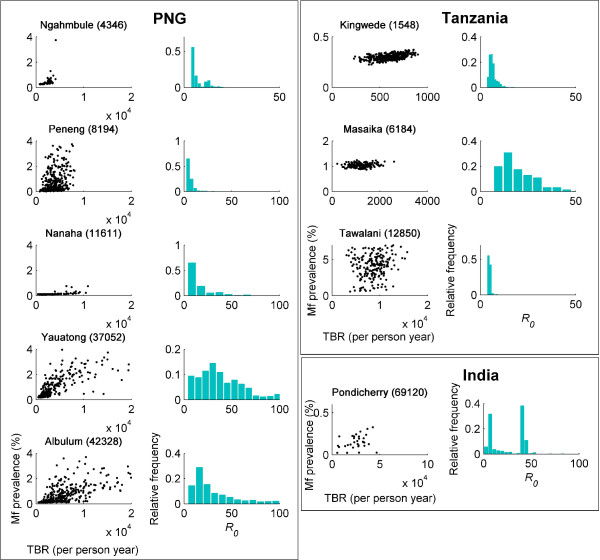
Figure 3.
Breakpoint and reproduction number estimates. Breakpoints versus threshold biting rates (TBRs; black scatter plots) and the estimated R0 (histograms) for the best-fitting parameter sets obtained from each of the data sets investigated in this study. Country and village names are given above each plot, along with annual biting rate values in parentheses.

