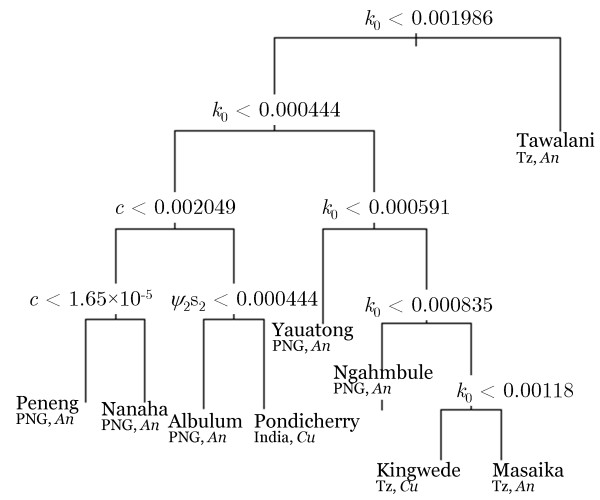
Figure 5.
Classification tree model showing the model parameters that differed significantly between the various study sites. The results show that differences in the infection aggregation parameter (k0), signifying how over dispersed infection among individuals in each community was (lower value higher the overdispersion), the acquired immunity parameter (c) and the establishment rate (ψ2s2), primarily underlay the variations observed in the parameter vector estimates obtained between the study communities investigated in this study. The cross-validated error rate of the displayed model (with eight splits) was low at approximately 1%. The classification tree was fit using the rpart package in R.

