
Figure 5.
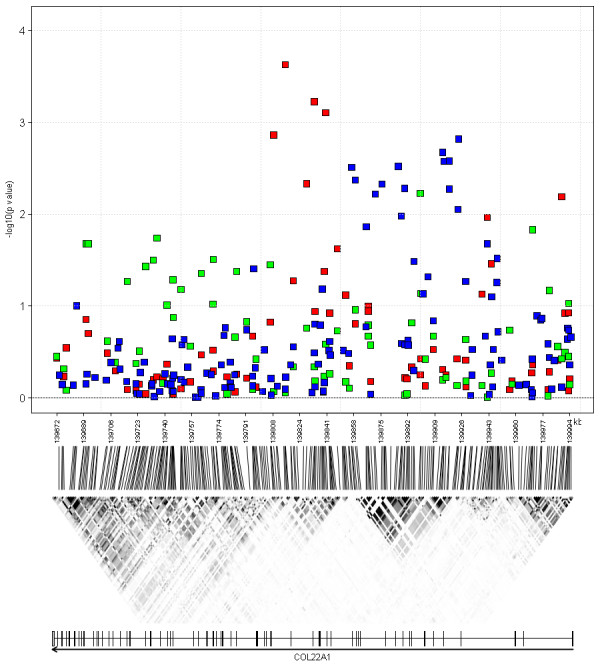
Genomic structure and association results at the COL22A1 locus. Upper panel: -log10(p values) are plotted by physical position for the EUROSPAN discovery meta-analysis (red squares), the popgen (blue squares) and the Korcula (green squares) replication cohorts. Middle panel: linkage disequilibrium (LD) as quantified by r2 (the higher the LD, the darker the color, with black indicating perfect LD), based upon the HapMap-CEU database, Phase III/Release 2, (NCBI build 36). Lower panel: genes located in the plotted region, with coding exons indicated by black rectangles and orientation.