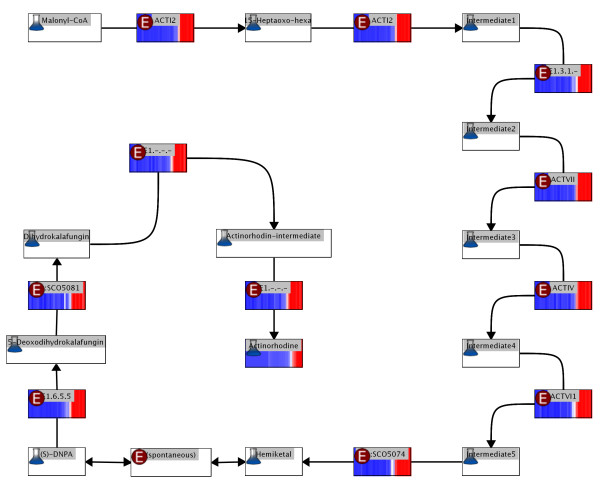
Figure 6.
Actinorhodin pathway. The actinorhodin pathway (based on ScoCyc pathway information) is visualized with overlaid enzyme expression values and and spectrometrically measured metabolite concentration colored using a red-blue gradient (red = low, blue = high). Consecutive time points are laid out from left to right in the gradient with the leftmost vertical line representing the first experiment (20 h after inoculation) and the right-most vertical line representing the final measurement (at 60 h after inoculation). Enzymes/reactions are marked with the letter "E", metabolites are marked with the image of an Erlenmeyer flask, both are labelled with the identifiers assigned by ScoCyc.

