
Figure 4.
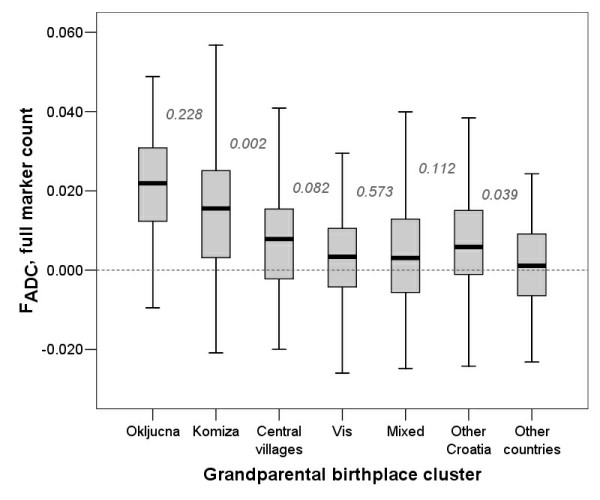
Grandparental birthplace clusters and their homozygosity estimates using FADC (full marker count). Numbers on the figure are P values of pair-wise comparisons between neighbouring group homozygosity estimates using Mann-Whitney test. Plot for FPLINK is not shown here due to very high correlation coefficient with FADC.