Figure 5.

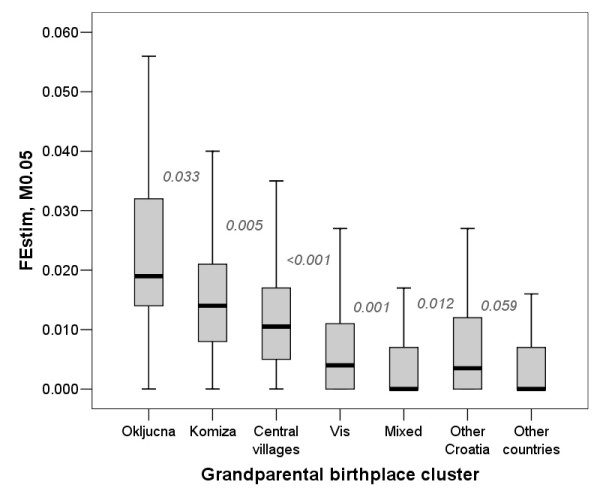
Grandparental birthplace clusters and their homozygosity estimates using FEstim (M0.05 selection). Numbers on the figure are P values of pair-wise comparisons between neighbouring group homozygosity estimates using Mann-Whitney test.

Grandparental birthplace clusters and their homozygosity estimates using FEstim (M0.05 selection). Numbers on the figure are P values of pair-wise comparisons between neighbouring group homozygosity estimates using Mann-Whitney test.