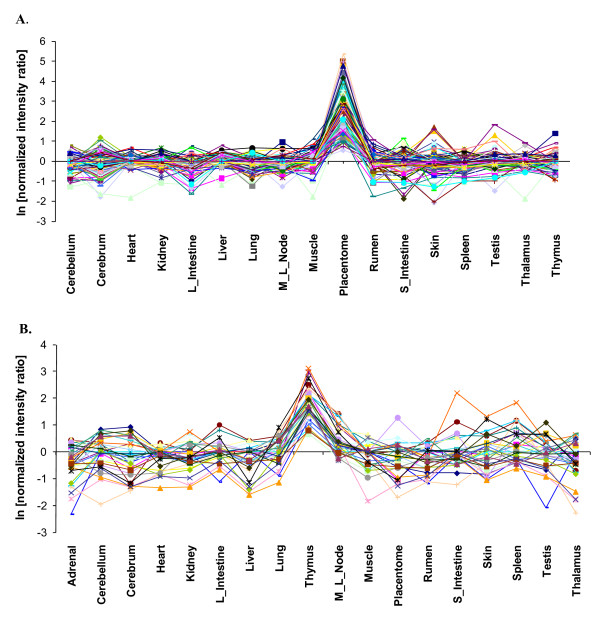
Figure 3.
Co-expression of genes in PLAC and THYM clusters. The average pairwise Pearson correlation (r) within each cluster was r ≥ 0.75. The correlation between any one of the LSTs and any known gene was r ≥ 0.90: A) Co-expression of LSTs 22JE, 34FL, and 104JE with 113 other genes using expression data from 18 cattle tissues. A cluster of 116 genes (PLAC) shows preferential expression in placentome, with each gene having ≥ 2-fold higher expression in placentome as compared to any other tissue: B) Co-expression of LSTs 383NG and 21PW with 30 other genes using expression data from 18 cattle tissues. A cluster of 32 genes (THYM) shows preferential expression in thymus with each gene having ≥ 2 fold higher expression in thymus as compared to any other tissue. L_Intestine, large intestine; M_L_Node, mesenteric lymph node; S_Intestine, small intestine.

