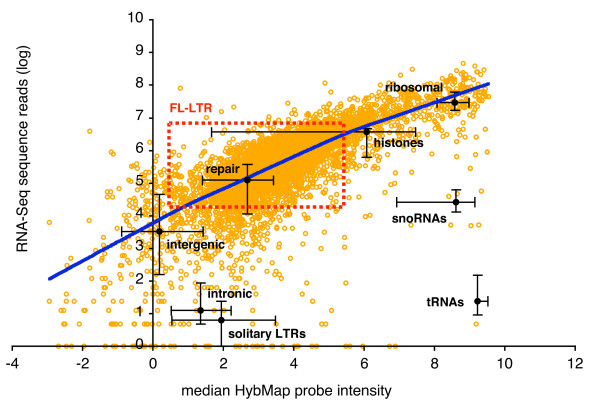
Figure 5.
Comparison of RNA-Seq and HybMap data. Scatter plot between RNA-Seq abundance and median HybMap intensities for all S. pombe protein-coding genes (orange circles). RNA-Seq abundance calculated as log(reads per loci). HybMap values defined as the median intensity of all probes mapping to a given feature on the forward strand. Lowess curve (blue line) for all protein-coding genes is plotted using two thirds of the observations as smoothing span. Black circles denote median values for genomic features as indicated on the figure (forward strand probes only), with error bars corresponding to 25 and 75 percentiles. The possible range of transcriptional activity from full-length LTR retrotransposons is outlined as a red rectangle with dotted lines (see main text for an explanation).

