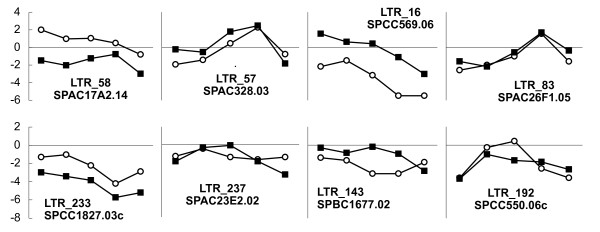
Figure 6.
Correlation of transcriptional activity. RNA-Seq expression profiles for eight solitary LTRs and their neighbouring protein-coding genes across five meiosis stages, M1-M5. For each stage, the log2 ratio between stage read coverage and read coverage in growth phase is plotted (the five points hence corresponding to the five meiosis stages). Genes are shown as black squares, LTRs as open circles. Gene names and LTR numbers (Additional file 1) are provided. Log2 ratio values are shown on leftmost axes only, but are identical throughout each row.

