
Figure 4.
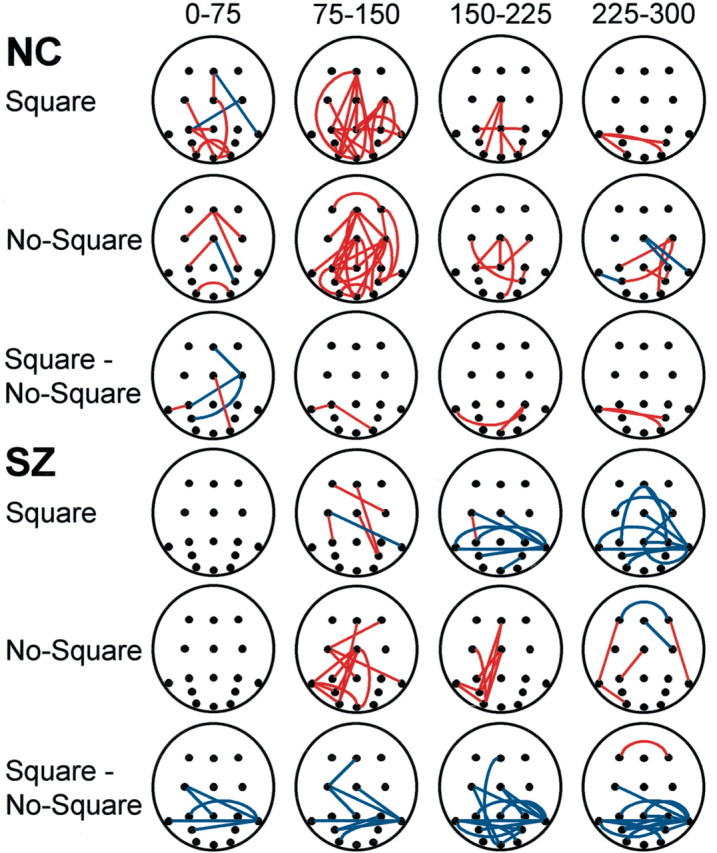
Phase coherence changes in the 37-44 Hz frequency bin plotted in space and time. Circles indicate electrode positions, with frontal sites at top and occipital sites at bottom. Red lines mark coherence increases between electrode sites, and blue lines mark coherence decreases.