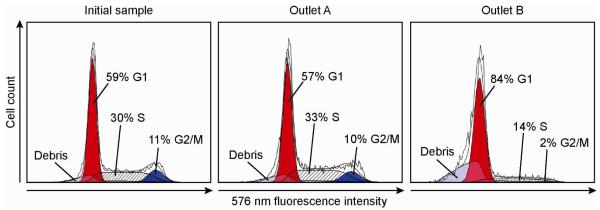
Figure 3.
Flow cytometry histograms showing cell cycle distributions before and after synchronization, based on measurements of red fluorescence (centered at 576 nm) after staining the cellular DNA with propidium iodide. The populations in each phase of the cell cycle were determined by fitting cell cycle models to the histograms (ModFit LT). The synchronized cell population at outlet B shows 84% of all cells in the G1 phase, with 14% in S phase and 2% in G2/M phase.

