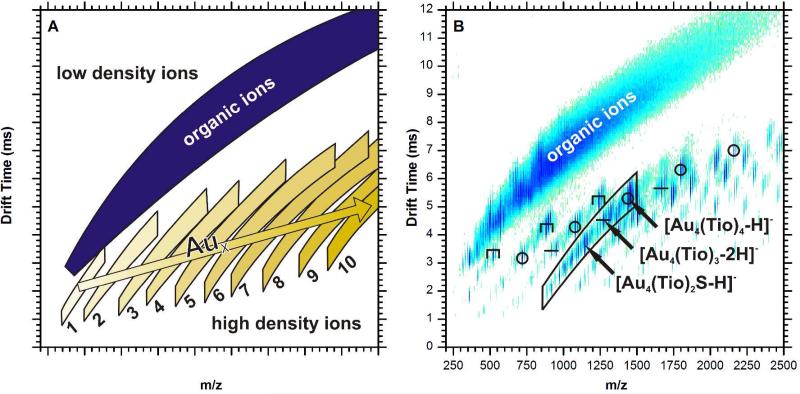
Figure 1.
An illustration of a typical ion mobility-mass spectrum of thiolate-protected AuNPs (A), where the numbers are x for Aux(SR)y, and an ion mobility-mass spectrum of tiopronin-protected AuNPs in negative ion mode (B). A broad band in the top-left of the spectrum is composed of organic ions. The small bands below and to the right of the major organic ion band correspond respectively to the number of gold atoms (x) contained in the ions of that band. Ions higher in each band correspond to species with a higher organic content, while ions lower in the bands have lower organic content, often due to fragmentation. The symbols above the ion species in the IM-MS plot indicate their assigned structure: ring (○), linear (–), and staple (Π). The placement of the ion species in the plot gives clues for structural analysis.

