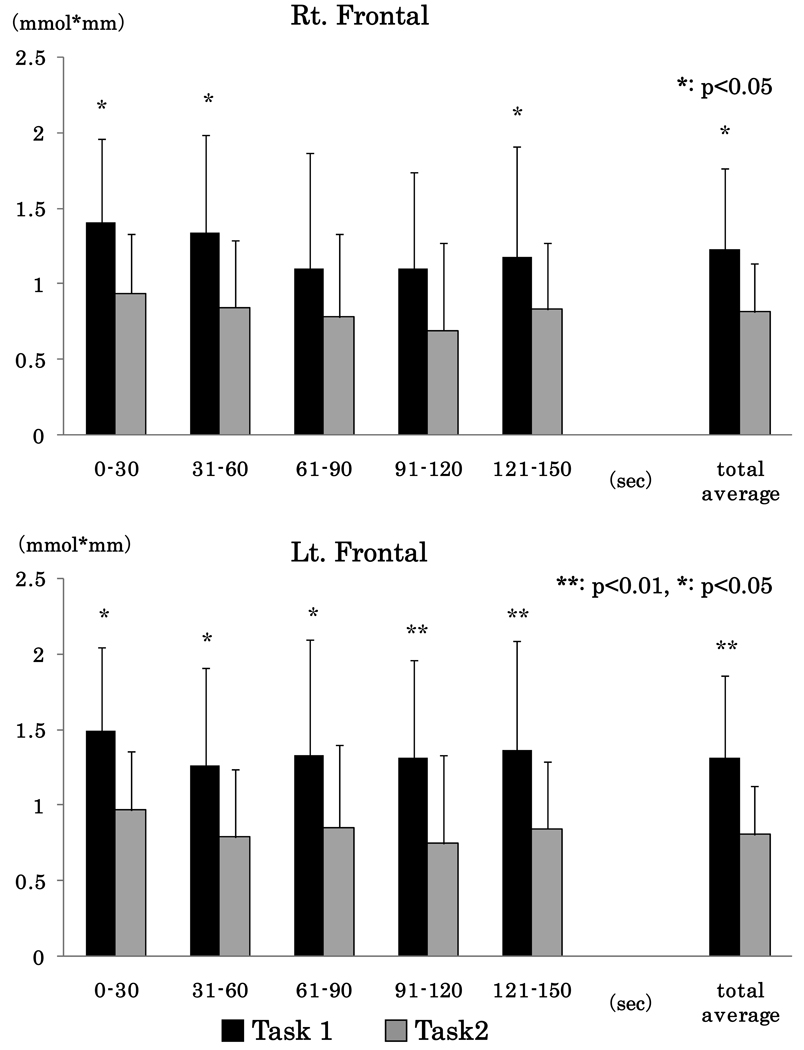
Figure 2. Time course and total average oxy-Hb values.
Average task-related changes of oxy-Hb signals from an arbitrary zero baseline at the start of the measurement period were calculated for each 30-sec epoch. The results of task–related changes of oxy-Hb values between the two tasks conditions are presented above for the right (upper figure) and left (lower figure) frontal areas. Time course changes of oxy-Hb values were significantly increased in response to the picture book reading versus video viewing in both frontal areas. Similarly, total averages of oxy-Hb values in both hemispheres were observed in picture book reading compared to video viewing.

