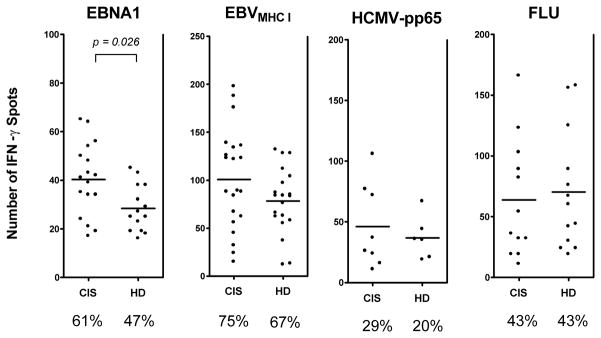
Figure 2. Increased frequency of EBNA1-specific IFN-γ producing T cells in patients with CIS.
T cell frequencies were quantified in 28 untreated EBV-infected patients with CIS and 30 healthy EBV carriers using an ELISPOT assay. PBMC were stimulated with an overlapping peptide library covering the C-terminal domain of EBNA1 (aa 400–641), pooled immunodominant MHC class I restricted EBV-derived epitopes and MHC class I restricted immunodominant CMV-encoded epitopes derived form the phosphoprotein 65 (pp65). In addition, PBMC were infected with human influenza virus (FLU). Frequencies are displayed as number of spots per 250,000 PBMC. The percentage of individuals showing a positive IFN-γ response towards each set of viral antigens is given below the diagrams. The non-parametric Mann Whitney U test was used to compare frequencies between CIS patients and controls (HD).

