Figure 3 .
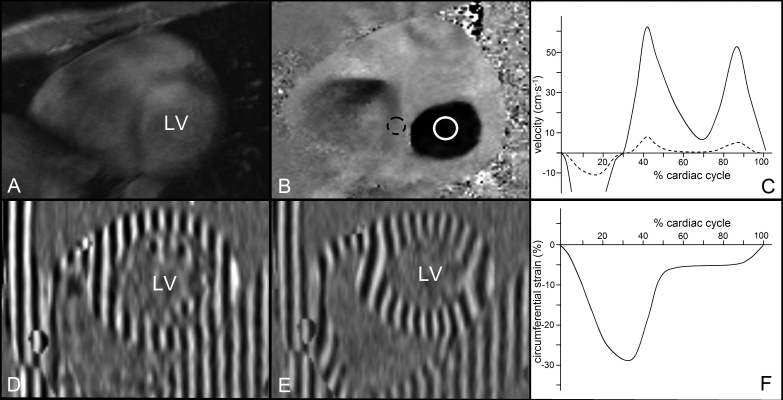
Cardiac magnetic resonance functional images. A) Short-axis, phase-contrast magnitude image, displaying the anatomical information. Magnitude images are used to define the regions of interest for velocity quantification. B) Matching flow encoded, phase-contrast image. Tissue moving at low velocities has an intermediate signal intensity (grey) and tissue moving at high velocities has either a low signal intensity (black) or high signal intensity (white), depending on the direction of movement. Regions of interest can be drawn on the myocardium (dashed circle) and in the mitral valve orifice (solid circle) in every phase of the cardiac cycle. C) From these data, myocardial velocity (dashed line) and mitral valve inflow curves (solid line) can be derived for analysis of systolic and diastolic function. D) Short-axis end-diastolic myocardial tissue tagging image. At this point in the cardiac cycle, a horizontal and vertical tagging pattern is applied on the myocardium. E) This tagging pattern deforms concomitantly with the in plane deformation of the myocardium throughout the entire cardiac cycle. The temporal resolution may reach up to 14 ms. From the deformation in two orthogonal directions, strain and rotation in every direction can be calculated. F) Circumferential strain is most frequently used for analysis of myocardial deformation. LV=left ventricle.

