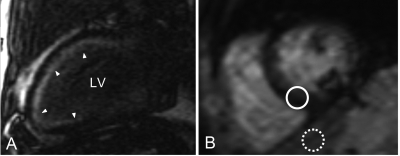
Figure 4 .
Cardiac magnetic resonance late gadolinium enhancement imaging. A) Two-chamber view of an amyloidosis patient with cardiac involvement. Note the global, subendocardial, ill-defined late gadolinium enhancement that is found in approximately 70% of patients (see arrowheads). B) Short-axis T2* weighted image of the left ventricle. Signal intensity of the septum has rapidly decayed, yielding a dark tone (solid circle) while signal intensity of the liver (dashed circle) is preserved. This demonstrates the poor correlation between T2* values of the liver and the Heart.

