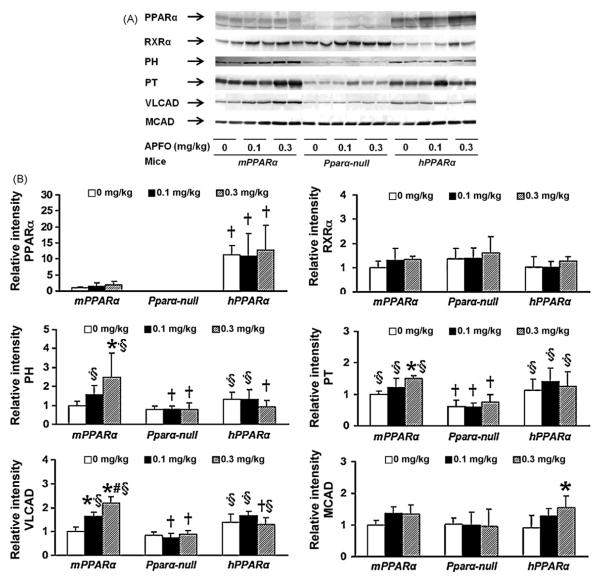
Fig. 2.
(A) Western blot analysis of hepatic PPARα and related genes. All mice from each treatment and genotype were examined across three numbers of gels, and one of them is shown here. (B) Western blot analysis of hepatic PPARα and the related genes (n = 4–6). Each band was quantified by densitometric analysis as described in Section 2, and mean strength of control in mPPARα mice was assigned a value of 1.0. Each column and bar represents mean and +S.D., respectively. A normalizing transformation was applied to PH value before Tukey–Kramer analysis. *Significantly different from respective controls (P < 0.05). #Significantly different from respective low dose groups (P < 0.05). †Significantly different from mPPARα mice treated with same dose (P < 0.05). §Significantly different from Pparα-null mice treated with same dose (P < 0.05).

