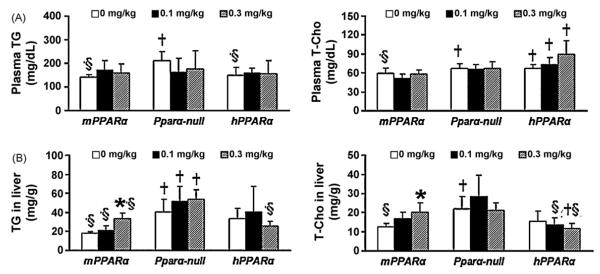
Fig. 3.
Plasma and hepatic TG and T-Cho levels. (A) Plasma, (B) liver (n = 4–6). Each column and bar represents mean and +S.D., respectively. *Significantly different from control in mPPARα mice (P < 0.05). †Significantly different from mPPARα mice treated with same dose (P < 0.05). §Significantly different from Pparα-null mice treated with same dose (P < 0.05).

