Figure 1.

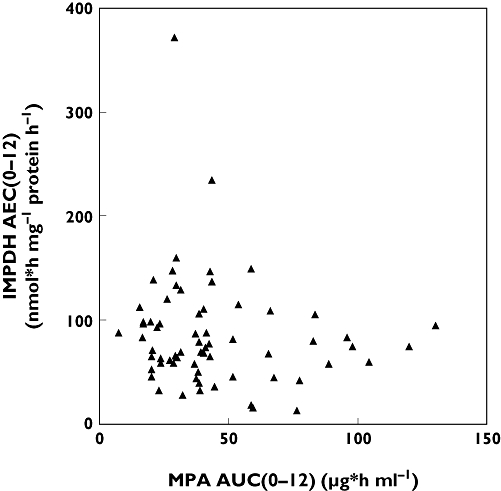
Association of MPA AUC0–12 and IMPDH AEC0–12 is demonstrated. AUC, area under the concentration–time curve; AEC, area under the enzyme activity curve; IMPDH, inosine monophosphate dehydrogenase; MPA, mycophenolic acid

Association of MPA AUC0–12 and IMPDH AEC0–12 is demonstrated. AUC, area under the concentration–time curve; AEC, area under the enzyme activity curve; IMPDH, inosine monophosphate dehydrogenase; MPA, mycophenolic acid