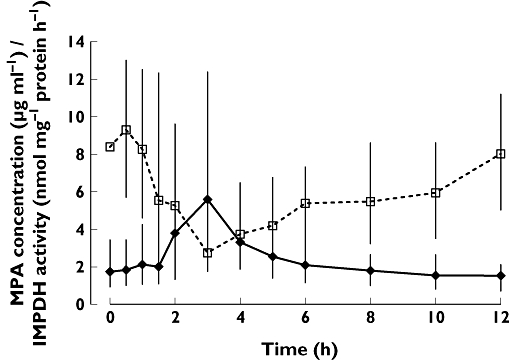
Figure 3.

Median time profiles of plasma mycophenolic acid (MPA) concentration and inosine monophosphate dehydrogenase (IMPDH) activity in peripheral mononuclear cells of 66 renal transplant patients on enteric-coated mycophenolate sodium (EC-MPS) therapy are presented (median, 25 and 75 percentile; solid line, MPA concentration; dashed line, IMPDH activity). MPA concentration [µg ml−1] ( ); IMPDH activity [nmol/mg protein/h] (
 )
)
