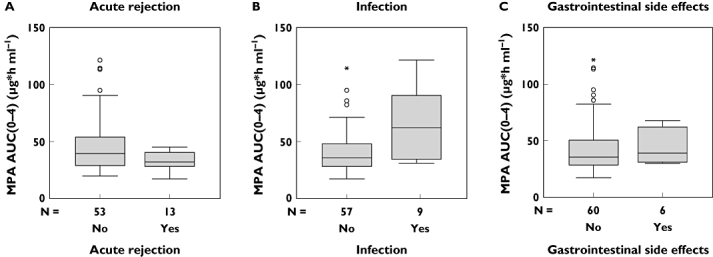
Figure 4.

Box and whisker plot shows the median, interquartile range, outliers (°) and extreme values (*) of the evaluated abbreviated sampling strategy MPA AUC0–4 in patients (a) with and without acute rejection episode (P < 0.05), (b) with and without recurrent infections (P < 0.05), and with and without gastrointestinal side-effects (NS). AUC, area under the concentration–time curve; MPA, mycophenolic acid
