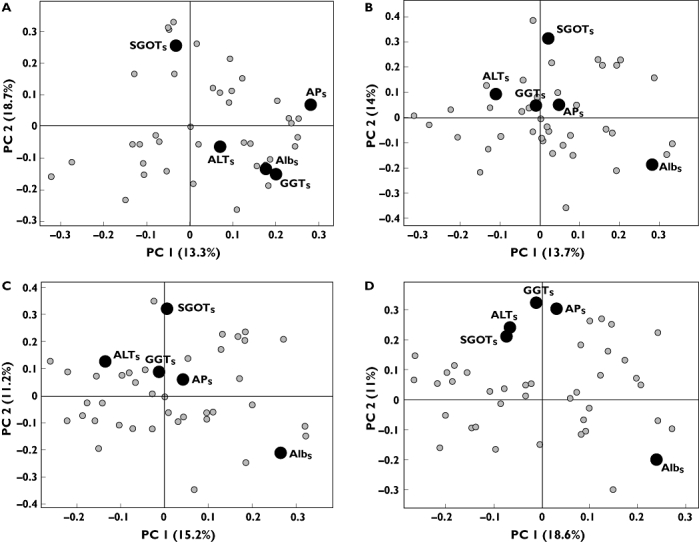
Figure 2.

Loading plot of component 1 vs. component 2 from principal component analysis model from regimen ‘5+9’. (a) Dose level 1 µg kg−1. (b) Dose level 1 and 3 µg kg−1. (c) Dose level 1, 3 and 10 µg kg−1. (d) Dose level 1, 3, 10 and 30 µg kg−1. Only labels for liver functionality parameters are included. Subscript: S, serum
