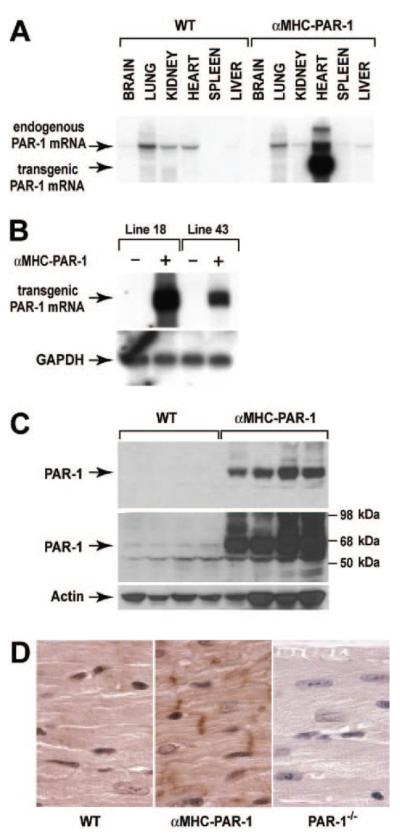
Figure 3.
Characterization of mice overexpressing PAR-1 in cardiomyocytes. A, PAR-1 mRNA expression was analyzed by Northern blotting in various tissues from transgenic (αMHC-PAR-1; line 18) and nontransgenic (WT) mice. Ten micrograms of total RNA was analyzed in each lane. PAR-1 mRNA expressed by the transgene is smaller than PAR-1 mRNA from the endogenous PAR-1 gene because it lacks most of the 3′ untranslated region. The larger bands may represent partially spliced transcripts. B, Comparison of PAR-1 mRNA expression in hearts from transgenic lines 18 and 43. GAPDH was used as a loading control. C, PAR-1 protein expression in αMHC-PAR-1 (line 18) mice and WT littermates was analyzed by Western blotting. Two exposures (shorter on top and longer below) are included to show the relative levels of PAR-1 in the 2 groups of mice. Four mice from each group are shown. D, PAR-1 expression in the hearts of WT, αMHC-PAR-1, and PAR-1−/− mice was analyzed by immunohistochemistry. Original magnification ×1000.

