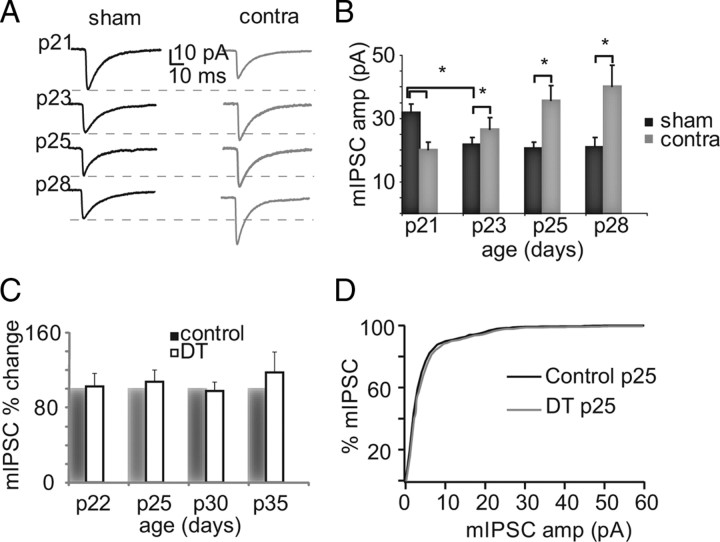
Figure 2.
Opposite plasticity of mIPSCs in pre-CP and the CP. A, Sample traces for sham and monocularly deprived (Contra) neurons at different ages. B, Bar plot summarizing the effect of MD in development. Asterisks indicate significant differences. C, Bar plot summarizing the effect of DT on mIPSCs. D, Cumulative distribution of mIPSC amplitudes for P25 control and DT rats.

