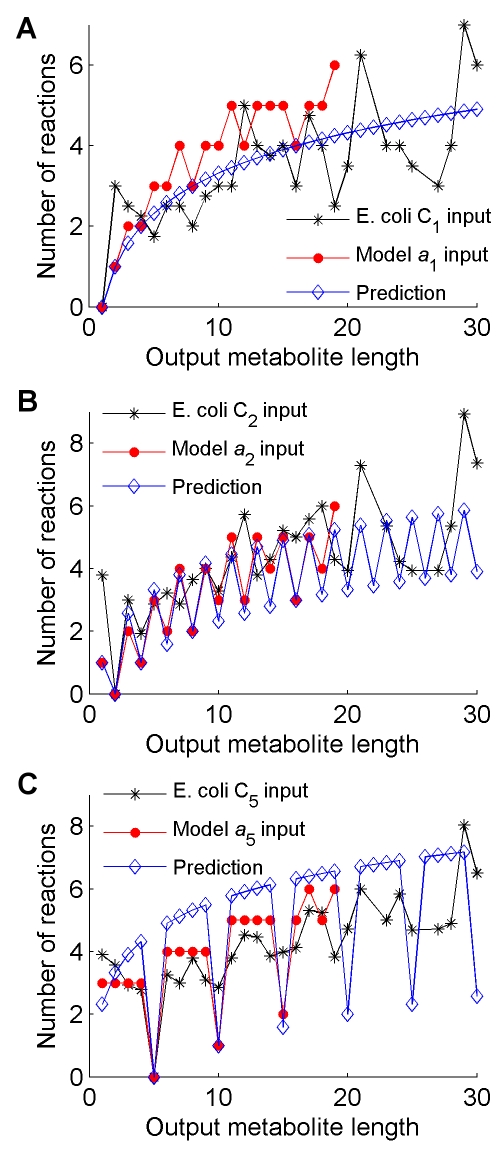
Figure 3. Logarithmic growth is observed among pathways from both the R 19 and E. coli metabolic networks.
Each plot has a single starting value i corresponding to either ai (for the model) or Ci (for E. coli). The red lines show the number of reactions in each MBP with different output metabolite size, and the black lines show the average number of reactions used to reach the nearest metabolite of increasing carbon number in E. coli. The predicted number of reactions from Equation (1) is also shown for each plot in blue. (A) C1/a 1 input. (B) C2/a 2 input. (C) C5/a 5 input.

