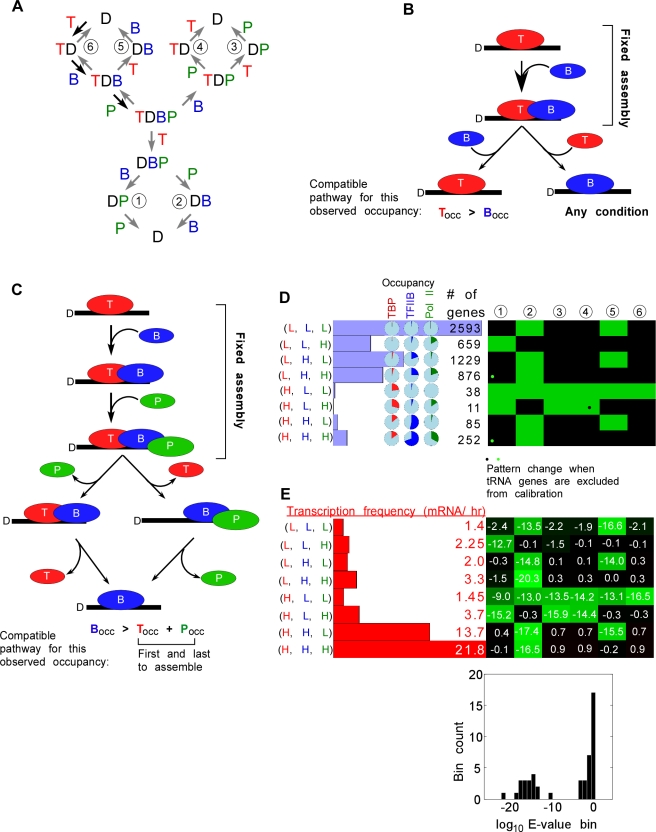
Figure 2. Three factor (TBP, TFIIB, and Pol II) modeling of genome-wide ChIP occupancy data.
A, Alternative dissociation pathways modeled are shown. The fixed assembly pathway is illustrated with the black arrows. B, The first rule of compatibility is pictorially represented. Note that, given the assembly pathway, the disassembly pathway on the left requires TBP occupancy to be greater than TFIIB occupancy, whereas the disassembly pathway on the right can support either TBP or TFIIB occupancy being greater. C, The second rule of compatibility is illustrated. If TFIIB occupancy is greater than the combined occupancy of TBP and pol II, then only the disassembly pathways shown will work. D, Membership bar graphs, occupancy pie graphs, and the PathCom compatibility cluster plot are described in Figure 1D. TBP binding was found to be highest at tRNA genes and we wanted to assess if removing these genes would substantially alter the compatibility pattern. We found that only 3 of 48 tests were affected (indicated by opposing green and black dots). Note that given the rules of compatibility, some columns (mechanisms) are more constrained than others. E, Transcription frequency bar graphs for each group is shown, along side the COPASI compatibility cluster plot. Below that, is a histogram showing the distribution of log10 E-values. It is clearly bimodal. The group of bars at the very left represent incompatible E-values, while the rest of them represent compatible E-values.

