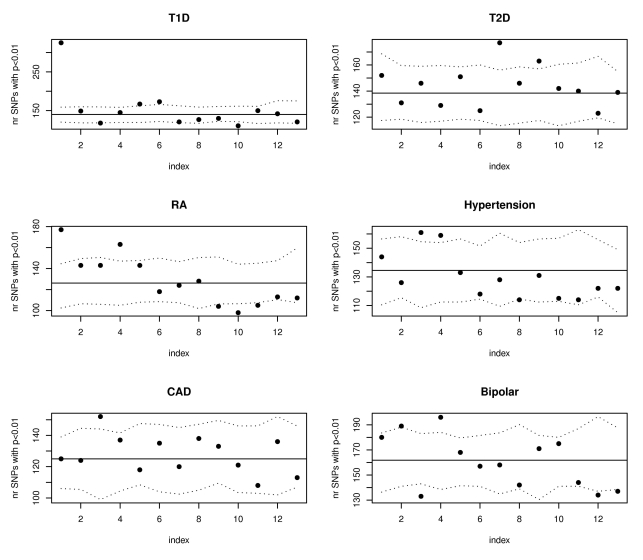
Figure 4. SNPs with the highest eQTL function scores are enriched for WTCCC T1D and RA susceptibility loci.
The plots show results of eQTL enrichment analyses for the remaining Wellcome Trust phenotypes beginning with SNPs having the highest expression scores (similar to analyses for Crohn's disease summarized in Figure 2). SNPs have been ordered according to their expression score from most significant to least significant and divided in groups of 10,000. Only the data from the first 13 groups is shown. The six plots correspond to the six other diseases investigated in the initial WTCCC GWAS. The dotted lines represent estimated 95% confidence bands obtained using simulations.

