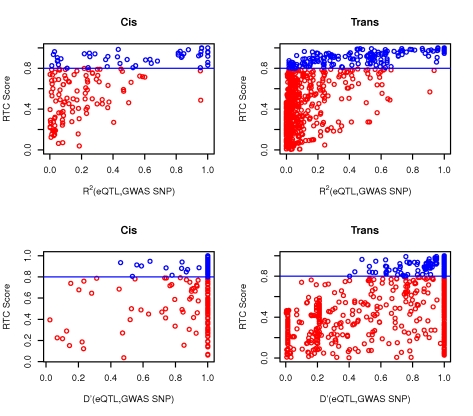
Figure 8. The RTC method compared to standard LD measurements in the observed data.
Neither r2 nor D' between the eQTL and the GWAS SNP are direct predictors of a high RTC Score. Highlighted here are the results from the cis and trans analyses. We obtain high scoring results (RTC Scores > = 0.8 in blue) for cases with a high correlation between the disease SNP and the eQTL as expected, but also for pairs with low statistical correlation (r2 – top panel). As shown in the bottom panel, many of these high scoring pairs are historically correlated (D' = 1), but so are many more by chance. Additionally, we can detect high scoring pairs with low D' as well. Hence, no obvious combination of the two LD measures can predict a high RTC Score.

