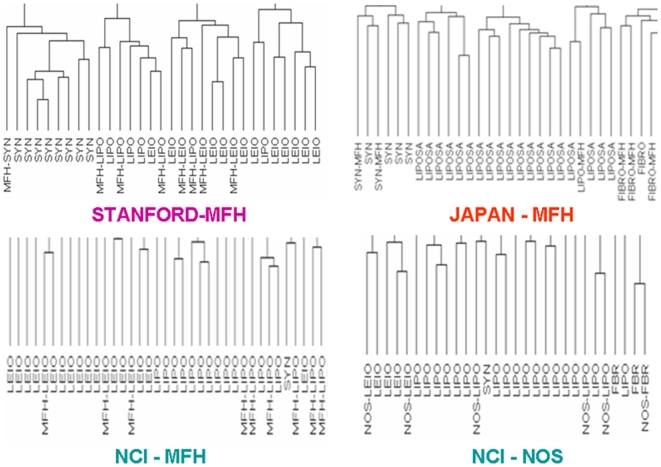
Figure 5. Assessment of MFH/NOS reclassification within each dataset.
Genome-wide hierarchical clustering reveals that MFH samples predicted as LIPO, LEIO, and SYN, clustered together with conventional LIPO, LEIO and SYN samples respectively. Similarly, NOS samples reclassified as liposarcomas leiomyosarcomas and fibrosarcomas clustered together with conventional LIPO, LEIO and FBR samples respectively. For Stanford dataset, the complete dendrogram is presented here. For the remaining datasets, due to size limitations, representative portions of the dendrograms are shown. Full dendrograms are shown in Figure S2, which also demonstrate that 24% of MFH samples (in total) did not cluster with the predicted subtypes.

