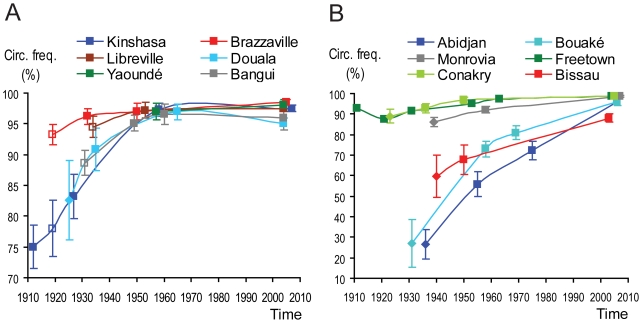
Figure 4. Estimates of male circumcision frequencies in Central African (A) and West African (B) cities.
The charts show, for each city, and at the referred time, the upper and lower estimates of male circumcision frequency. The cities and times of estimates are the same that appear in the bars of Figure 3. Each estimate is based on either: i) a published census or survey partitioning by ethnicity (filled squares); ii) assumption of the same ethnic distribution as in a neighboring time point for which there is a census or survey (shallow squares); iii) published numbers for some ethnic groups, and estimates for some relevant others (lozenges); iv) present time estimates for each city are assumed to be similar to the national prevalences measured by the DHS, because the latter are above 95% for nearly all relevant countries, and this, considering the current high levels of ethnic mixing seen in African major cities, leaves little room for a major city to differ from the national average. Except for the situation iv) above, circumcision frequencies are estimated based on the ethnographic information about the circumcision practices of each group, according to an algorithm described in Text S2, and the supporting calculations are implemented in Dataset S1.

