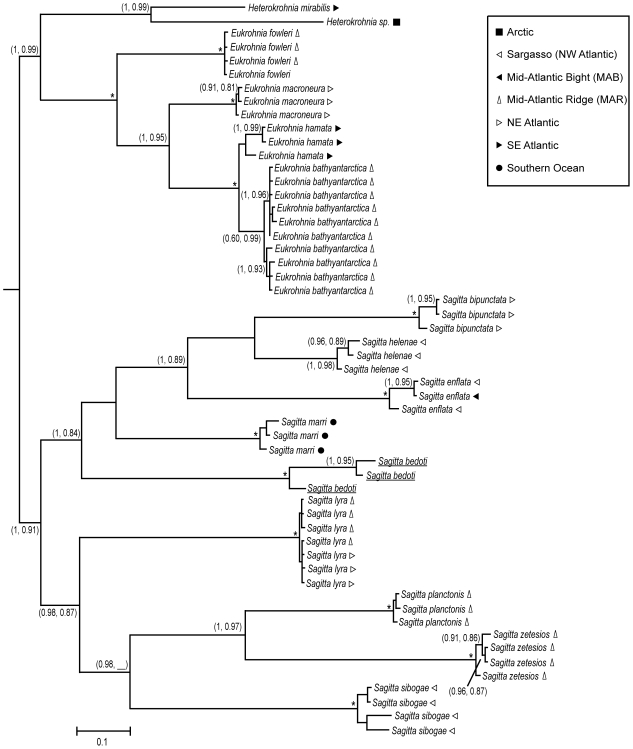
Figure 3. Gene tree for COI, showing topology and branch lengths from Bayesian analysis.
Pairs of numbers in parentheses are support values, given as (Bayesian posterior probabilities, approximate Likelihood Ratio Test support), with asterisks indicating maximum support of (1.00, 1.00), and blanks indicating topologies not recovered in that analysis. Scale bar denotes distance along branches. Underlined sequences were obtained from GenBank. Symbols following species names depict sampling location.

