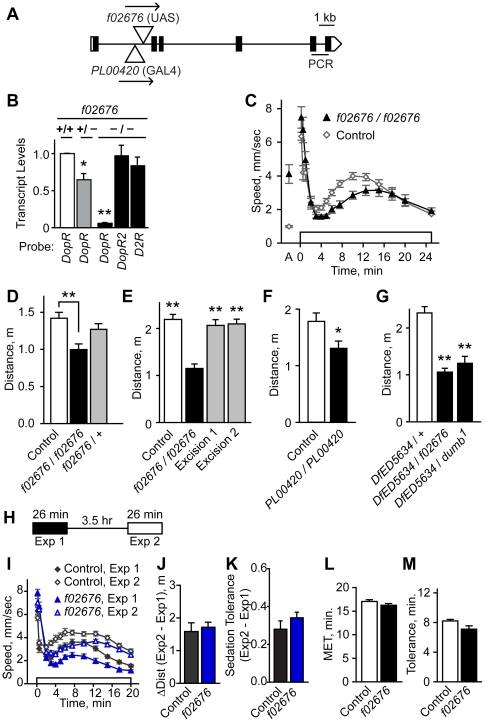
Figure 5. Molecular and behavioral characterization of DopR mutants.
A. DopR gene structure. Positions of the transposons f02676 and PL00420 are indicated in the DopR locus. Arrows indicate orientation of UAS sites for f02676 and GAL4 for PL00420. Black rectangles indicate the single predicted open reading frame. B. Relative to genetic background controls, DopR transcript levels were nearly eliminated in DopRf02676 homozygotes (−/−), whereas transcript levels of the DA receptors DopR2 and D2R were unchanged, as determined by quantitative RT-PCR (*P<0.05, **P<0.01, 1 way ANOVA, Dunnet's multiple comparison test to control, n = 3 replicates). DopR PCR probeset location is indicated in A. C, D. Ethanol-induced locomotor activity was reduced in DopRf02676 homozygotes (**P<0.01, 1 way ANOVA, Tukey's multiple comparison test, n≥11). E. Precise excision of f02676 reverted the ethanol-induced hyperactivity phenotype (**P<0.01, 1 way ANOVA, Dunnett's multiple comparison test, n = 12). F. Reduced ethanol-induced hyperactivity in DopRPL00420 homozygotes (*P = 0.0116, 2 sample t-test, n = 11). G. Non-complementation for ethanol-induced hyperactivity by DfED5634, a deficiency that deletes the entire DopR locus, for the DopR f02676 and the dumb1 inversion alleles (**P<0.01, 1 way ANOVA, Dunnett's multiple comparison test, n≥6). H–K. DopR mutants develop normal ethanol tolerance. H. Ethanol exposure scheme to induce and measure rapid ethanol tolerance. Flies were exposed twice for 26 min each to ethanol vapor (60%), separated by a 3.5 hr rest period. Locomotor activity was quantified for both exposures, and the number of flies sedated was counted immediately after each exposure. I. Locomotor activity profiles for exposure 1 and 2 for genetic background control and DopRf02676 flies. J. No change in distance traveled was detected from 2–25 min, Exposure 2 minus Exposure 1 (ΔDist) (P = 0.6691, paired t-test, n = 15). K. Sedation tolerance, the fraction awake exposure 2 minus exposure 1, was unaffected (P = 0.27, 2 sample t-test, n = 15). L. Ethanol sensitivity as measured in the inebriometer was unaffected (P = 0.16, 2 sample t-test, n = 5). M. Rapid tolerance, as measured in the inebriometer, was unaffected (P = 0.09, 2 sample t-test, n = 5).

