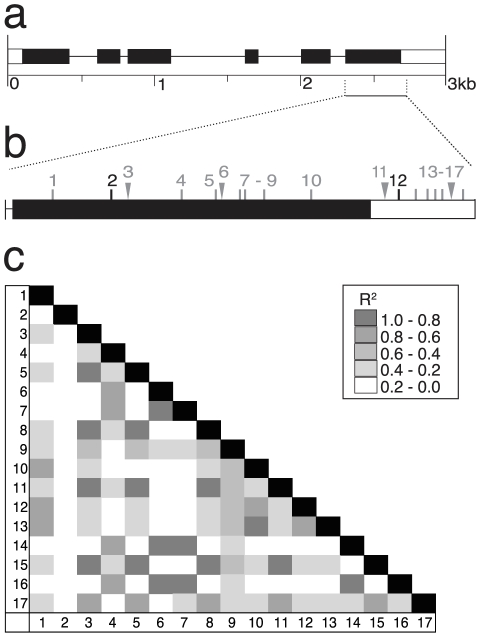
Figure 6. Characterization of ZmALMT2.
(a) Predicted gene structure for the ZmALMT2 locus is shown, with exons as black boxes, introns as thin lines, and UTRs as open boxes. For ease of presentation, polymorphisms detected in the 27 DL complete gene sequencing are not shown. (b) A focus region of ZmALMT2 was sequenced in the association panel. Four indels and thirteen SNPs were detected; two SNPs were significantly associated with aluminum tolerance and are shown in black (#2, #12). (c) Linkage disequilibrium plot for all polymorphisms detected within the focus region at ZmALMT2. Site 2 is associated with aluminum tolerance differences but is in linkage equilibrium with all other sites, while site 12 has moderate linkage disequilibrium with many sites within the focus region.

