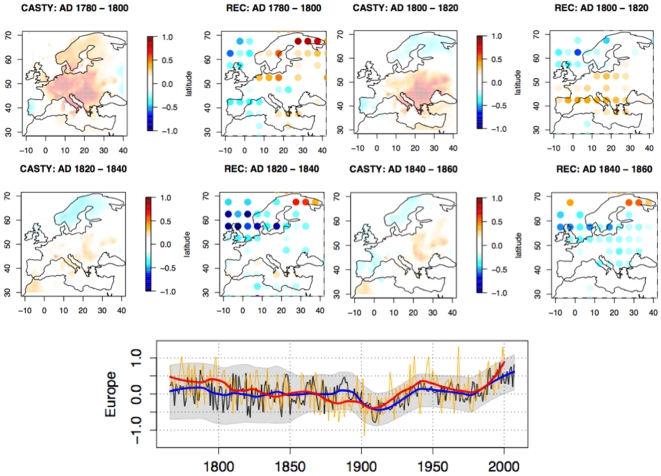
Figure 3. Comparison of the reconstruction of the April to September temperature anomalies (this paper) with the one produced by [19].
The above panel presents maps for several time periods. The CASTY maps have a 0.5° resolution while the reconstruction in this paper has a resolution of 5°. The lower panel show the mean temperature for Europe: in orange, the CASTY series (trend in red) and in black, this paper's reconstruction (trend in blue) with (in grey) the 90% confidence interval.

