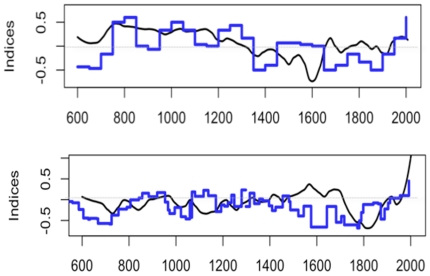
Figure 5. Comparison of the reconstructions and glacier curves.
In black, the smoothed April-September temperature of the [7.5°E, 47.5°N] and [2.5°E, 62.5°N] grid-points and in blue, the advance and retreat glacier curve of respectively Aletsch glacier and group of Scandinavian glaciers [22], [23]. The temperature curves are in °C (anomalies) and the glacier curves in dimensionless units.

