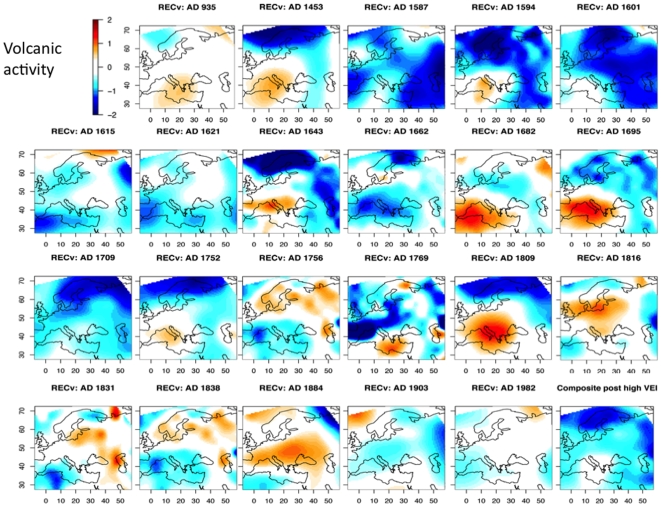
Figure 6. Maps of April to September temperature anomaly reconstructions for the coldest reconstructed year among the three years starting at a volcanic eruption event.
The most explosive eruptions have been analysed, for example: 1991 (Pinatubo, Philippines), 1912 (Novarupta, Alaska), 1902 (Santa Maria, Guatemala), 1883 (Krakatoa, Indonesia), 1815 (Tambora, Indonesia), 1783 (Laki, Iceland), 1600 (Huaynaputina, Peru), 1452–1453 (Kuwae, Vanatu), and 934 (Laki, Iceland); but also the events with a large volcanic explosive index (VEI) such as reported by [29], [30]. The lower right map is a composite map calculated as an average of the 22 other maps.

