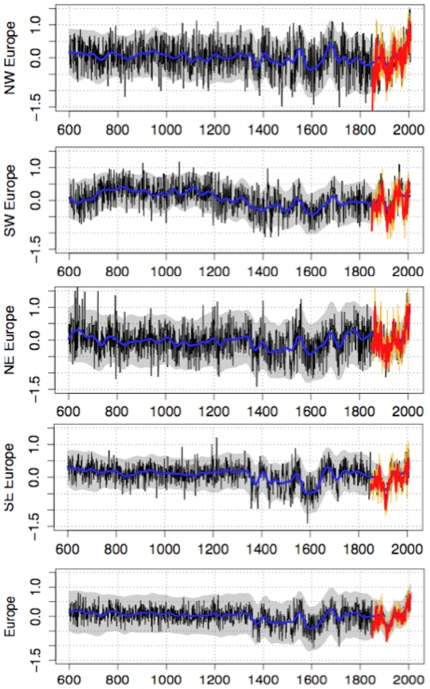
Figure 8. Mean April to September temperature anomalies averaged on various parts of Europe.
The black lines represent the reconstructions, the smoothed smoothed confidence interval at 95% are displayed in grey, the blue line is the smoothed reconstruction, orange and red lines are respectively raw and smoothed observations. (a) Eur_SW, Europe south of 45°N and west of 20°E, (b) Eur_SE, Europe south of 45°N and east of 20°E, (c) Eur_NW, Europe north of 45°N and west of 20°E, (d) Eur_SE, Europe south of 45°N and east of 20°E, (e) Eur_mean, whole of Europe. The gridpoints for which RE<0 were excluded from the average.

