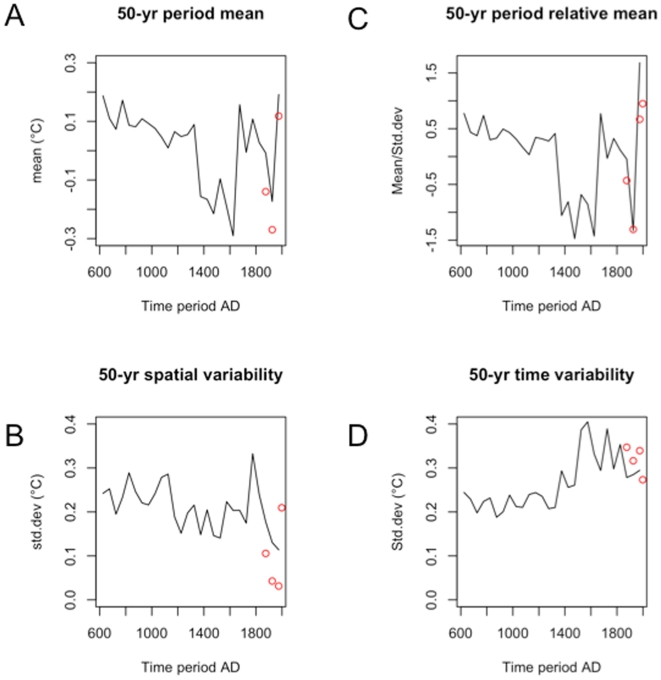
Figure 10. Comparison of means and variances.
(A) Sliding spatial mean and (B) variance calculated on 50-yr maps (we have first calculated 50-yr maps and then averages and variances of these maps). Panel (C) represents the ratio of curves (A) and (B). Panel D represents the standard deviation of the European mean temperature by 50-years intervals. Black lines represent the reconstructions and red circles represent the observations.

