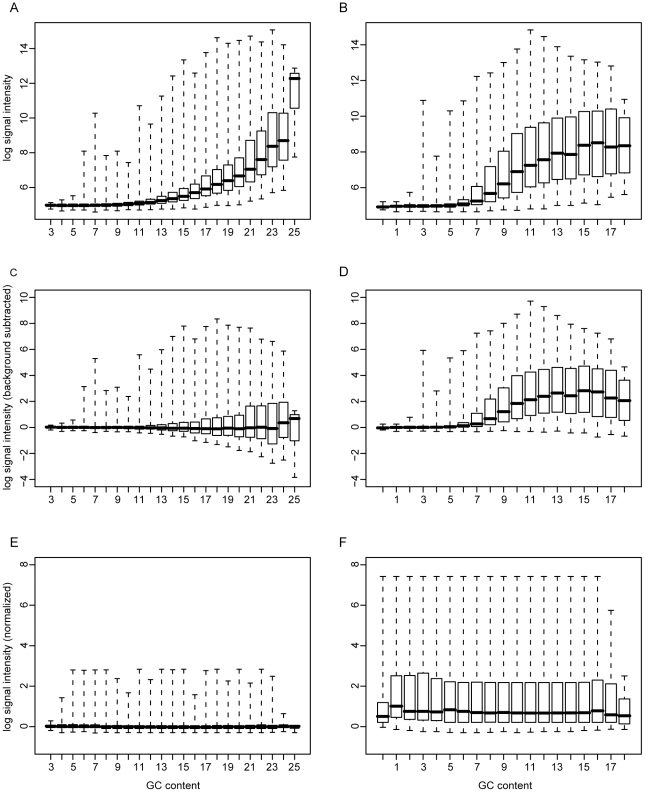
Figure 1. Correlation of signal intensity with GC content.
RNA from vaccinia-infected cells was hybridized to the chip. Each boxplot shows the signal intensity of probes on the chip grouped by their GC content. The boxes are drawn extending from the 25th to the 75th percentile with the medians marked by horizontal lines. The whiskers extend to the minima and maxima of the distributions. A. Nonspecific background probes (12,192) prior to subtraction. B. Vaccinia-specific probes (97,344) prior to subtraction. C. Nonspecific background probes after subtraction of median GC signal. D. Vaccinia-specific probes after subtraction of median background signal. E. Nonspecific background probes after background subtraction and distribution mapping to a GC content level of 8. F. Vaccinia-specific probes after background subtraction and distribution mapping to a GC content level of 8.

