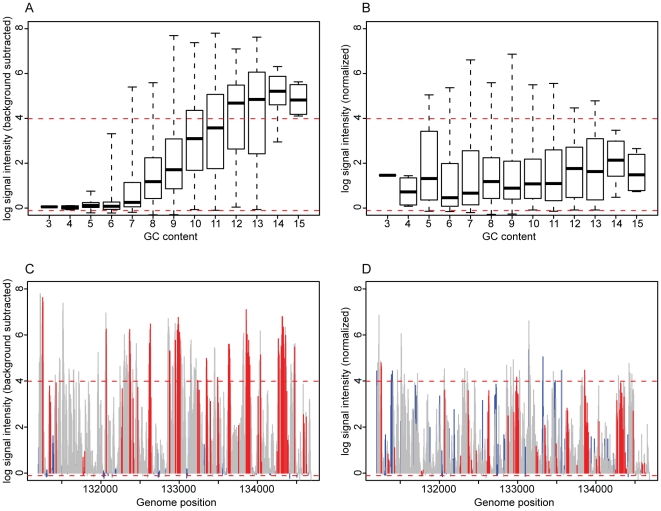
Figure 2. Removal of GC-dependant signal intensity.
A. Probes that hybridize to a transcript of VACWR144 (N = 867) are grouped by their GC content and presented as a boxplot as in Figure 1. The dashed, red lines indicate 10th and 90th percentiles of probe signal intensity for a GC content of 8. All probes are normalized to this probe distribution in B, forcing the distributions into a common range and eliminating the signal GC dependence. C. The background-subtracted signal intensities of all probes that hybridize to VACWR144 are plotted along their genomic coordinates. Probes are colored according to their GC content (high = red, low = blue, medium = grey). D. The normalized signal intensities of the probes plotted in C, with the same color scheme.

