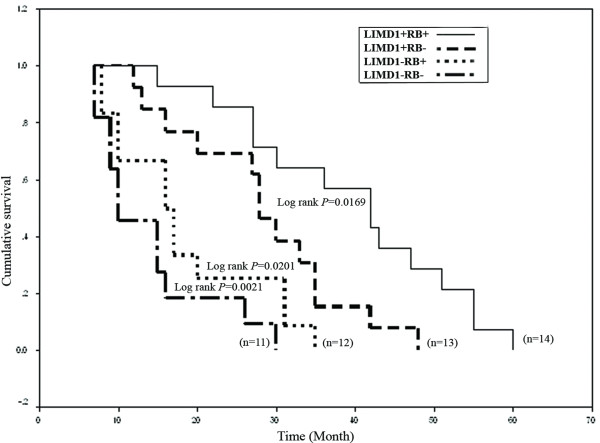
Figure 6.
Kaplan-Meier 5-year survival probability curves with cumulative survival of HNSCC patients by molecular alteration status in LIMD1 and RB1 loci. Solid line represented survival probability without molecular alterations of these two genes (wild type, denoted as '+') and dashed line represented the same probability with molecular alterations of either of these genes ('-' indicating altered state). n, total number of HNSCC samples studied in each case.

