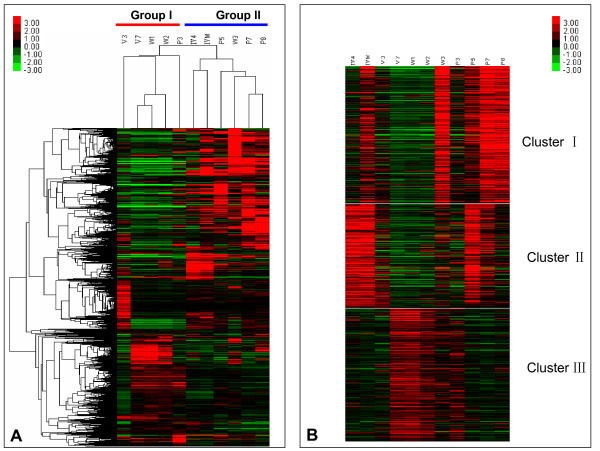
Figure 1.
Heat map of hierarchical clustering of 6676 genes expressed in epidermal tissues. Genes expressed with signal intensity more than 800 were included in this analysis. Clustering was done using Cluster 3 software (clustering type: hierarchical clustering, Distance metric: Pearson correlation). The colors in the map display the relative values of all tiles within the given 11 developmental stages; green indicates the lowest expression, black indicates the intermediate expression, and red indicates the highest expression. The numerical values give the actual values on a log 2 scale, which were associated with each color. The color scale bar is shown at the top right corner of the figure. A: Genes clustered by the given 11 developmental stages. B: Genes grouped into three clusters on the basis of the similarity of expression.

