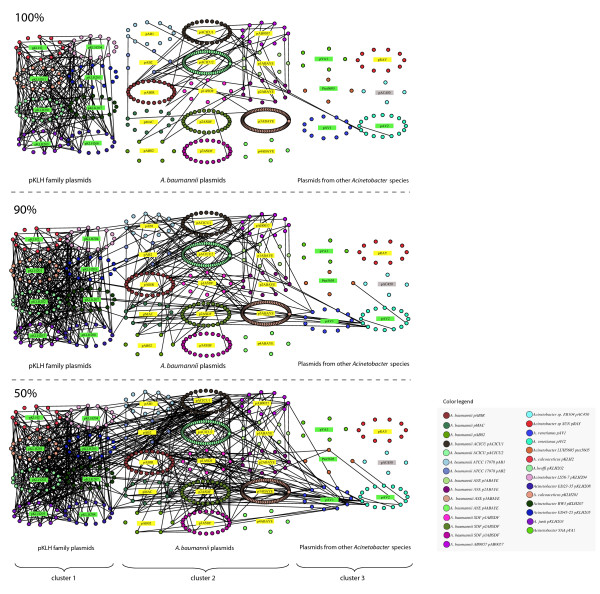
Figure 1.
Identity based networks of the 493 Acinetobacter plasmid encoded proteins. All the proteins belonging to the same plasmid (nodes) are circularly arranged and are linked to the others according to their identity value. The resulting pictures for three different identity thresholds (100%, 90%, 50%) are shown. Plasmids names have been colored according to the habitat of their source microorganism: yellow indicates clinical sources, green indicates environmental sources, grey indicates that habitat information was not available.

