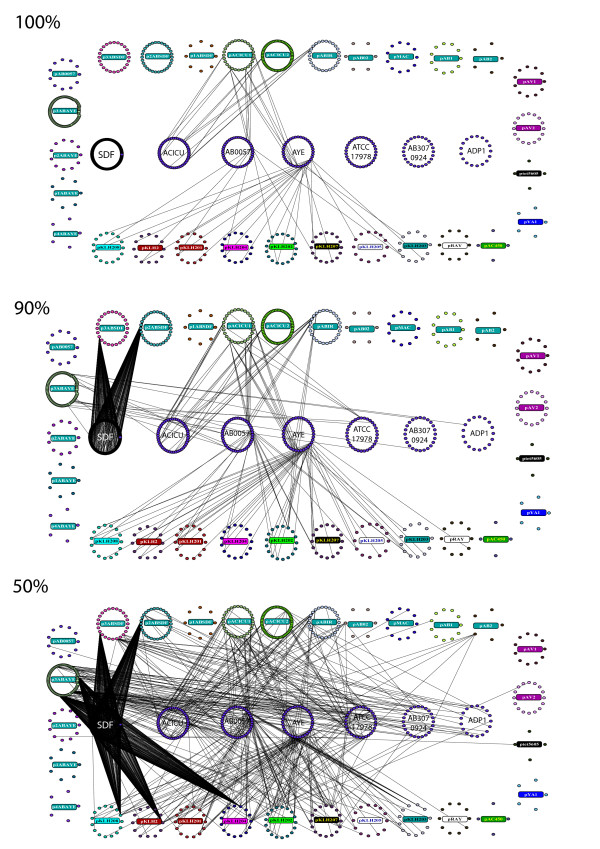
Figure 4.
Identity relationships between the proteins of the Acinetobacter plasmid and mini-chromosome proteins. Mini-chromosomes (see text for the details of mini-chromosomes construction) are shown in the center and plasmids are circularly arranged. 100%, 90% and 50% identity threshold are shown. For clarity purposes, only the name of the corresponding strain is reported on minichromosomes. Plasmids color legend as in Figure 1.

