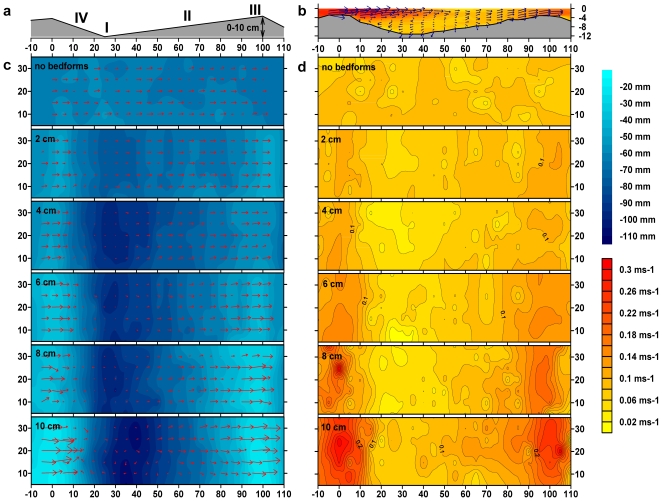
Figure 1. Constructed landscapes differing in flow heterogeneity.
Graphs describe shape of and hydrodynamic conditions over approximately one bedform (38 per flume). X-axis represents longitudinal flume dimension (equivalent to main flow direction, total flume length 40 m) with distances given in cm. (a) Side-view of impermeable 1-m-long bedform lining the bottom of the mesocosm. Bedforms of variable height (2–10 cm) were used to create the heterogeneity gradient. I, II, III and IV show the positions (“microhabitats”) of ceramic coupons used for determination of biomass and T-RFLP. (b) A representative vertical cross section along the thalweg in the flume with 8 cm bedforms showing water velocity conditions above a single bedform. Y-axis represents depth below water surface (in cm), contours show length of velocity vector, blue arrows show amount and direction of current. (c) and (d) show contour plots of depth (c, blue) and velocity (d, length of 3-D vector Rxyz, yellow-orange) above a single bedform in each of the 6 heterogeneity treatments, Y-axis represents lateral flume dimension (distances in cm, total flume width 0.4 m) and red arrows show amount and direction of current.

