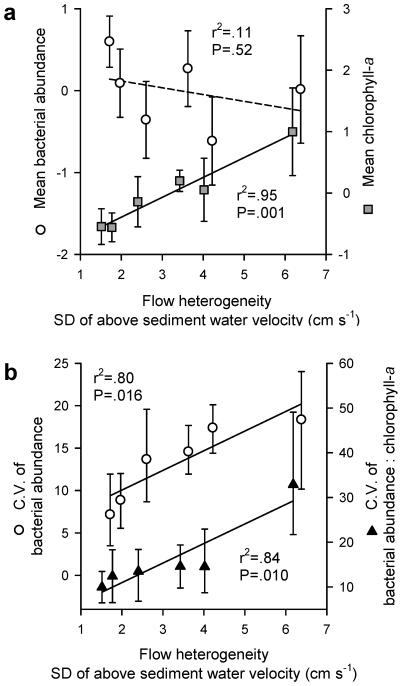
Figure 2. Microbial biofilm biomass.
(a) Flow heterogeneity (SDRxyz) versus mean z-standardised bacterial abundance and chlorophyll-a (error bars represent 95% confidence intervals, sample size n = 12 per flume); and (b) flow heterogeneity versus the average coefficient of variation of bacterial abundance and the bacterial abundance to chlorophyll-a ratio (error bars represent 95% confidence intervals generated by bootstrapping, sample size n = 4 per flume, see Methods).

