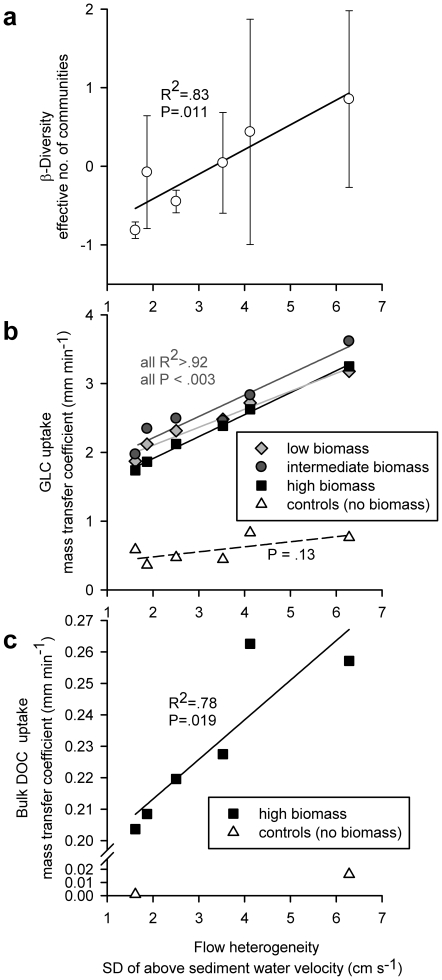
Figure 4. Relationship between flow heterogeneity and bacterial biodiversity and carbon mass transfer.
The standard deviation of R xyz (i.e. the length of the 3-dimensional vector of velocity) explains (a) b-diversity, as the effective number of communities using an Hill exponent q = 1 (data pooled from multiple sampling dates and z-standardised, sample size n = 4 per flume on each of 4 dates); (b) glucose mass transfer coefficients at various biofilm growth states; and (c) bulk DOC mass transfer coefficients. Triangles indicate controls with no biofilms in (b) and (c).

