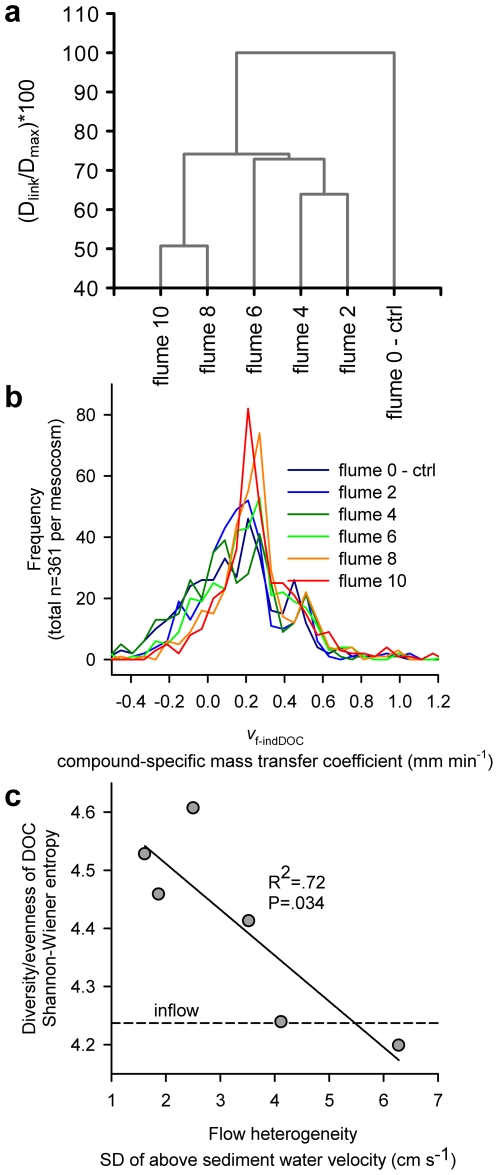
Figure 5. DOC resource use.
(a) Dendrogram (UPGMA clustering algorithm) showing similarity of resource use distribution among all 6 flumes with increasing flow heterogeneity (height of bedforms in cm). An Euclidean distance matrix was calculated from normalized mass transfer coefficients of 361 DOC compounds present in all residual (after recirculation) and inflow samples. (b) Frequency distributions of compound specific mass transfer coefficients (n = 361) in all 6 flumes. (c) Shannon-Wiener diversity/evenness of the molecular composition of the residual DOC pool. Note the similar evenness of the inflow (dashed line) and residual DOC pools in the high-heterogeneity landscapes. The decreasing trend indicates a gradual additional uptake of compounds of low relative concentration in the inflow with increasing heterogeneity (analysis on 361 individual compounds identified from all samples).

