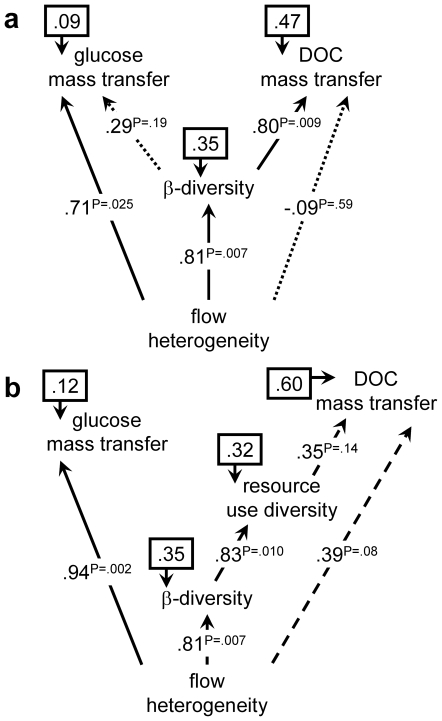
Figure 6. Metavariable path diagrams.
Path coefficients were calculated from Mantel statistics (Table 1). Diagram (a) and (b) with and without resource use diversity, respectively. Line style indicates significance of link. Numbers in boxes represent error variances (%). See Figure S4 for further path diagrams.

