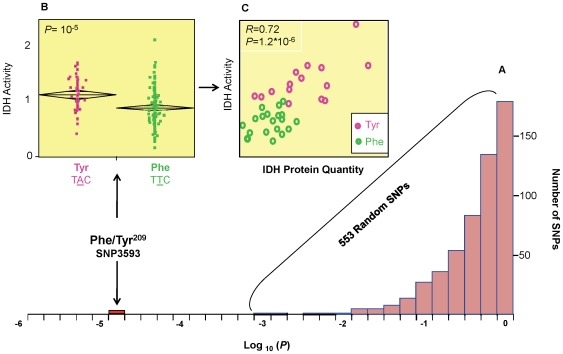
Figure 2. Effect of Phe/Tyr209 on IDH enzyme activity and protein quantity.
(A) Frequency distribution of association tests P-values for 553 random SNP (pink bars) and idh SNP3593 (red bar). On the X axis are the log10 (P) values for association tests using mixed-linear model. (B) Comparison between the two alleles at SNP3593 for IDH activity. A combined standardized IDH activity data from the two incubation temperatures is presented. (C) Correlation between IDH total activity and IDH protein quantity across a subset of 35 lines. Each point represents the mean of 3 biological replications.

